Bitcoin Eyes $130,000 If Fed Signals Dovish Policy

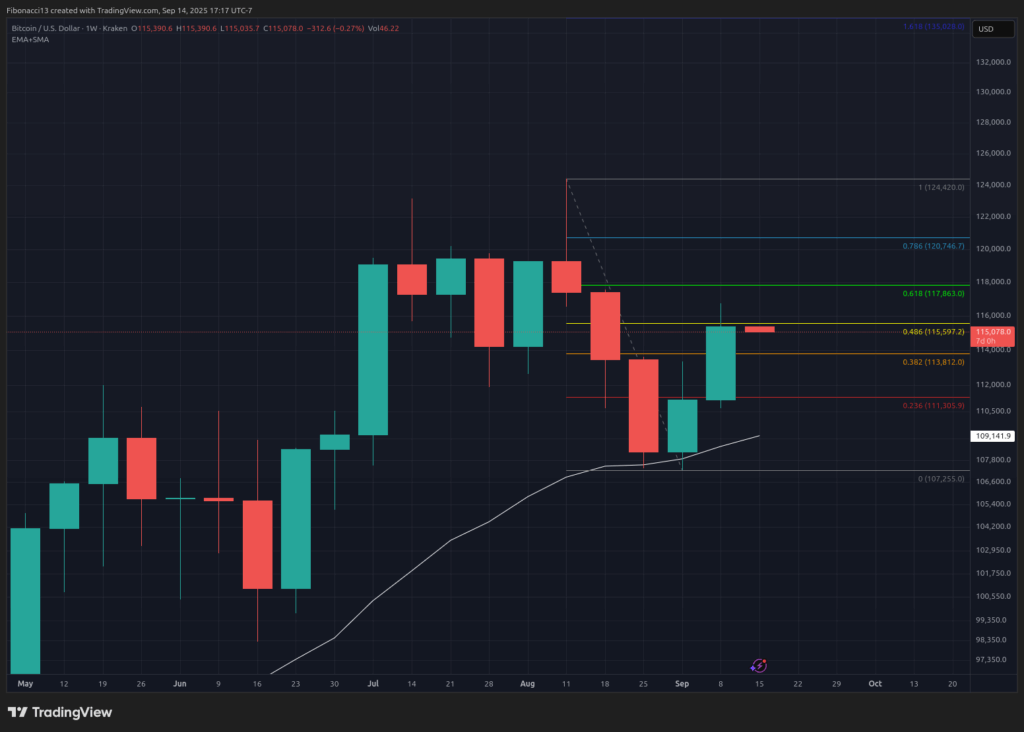
Bitcoin Price closed last week at $115,390, briefly breaching the $115,500 resistance level as it pushed into the weekend, only to dip back down and close the week out just below it. Last week produced a strong green candle for the bulls, maintaining upward momentum into this week. The U.S. Producer Price Index came in well below expectations on Wednesday morning last week, giving market bulls hope for the impending rate cut decision by the Federal Reserve. U.S. inflation data the following morning was lukewarm, however, as it registered at 2.9%, as expected, but higher than the previous month’s reading of 2.7%. The Federal Reserve will have its work cut out for it this week at Wednesday’s FOMC Meeting, where it must weigh the benefits and drawbacks of cutting or not. The market is fully expecting a 0.25% interest rate cut (as seen in Polymarket), so any hesitation now by the Fed will likely lead to a market correction.
Key Support and Resistance Levels Now
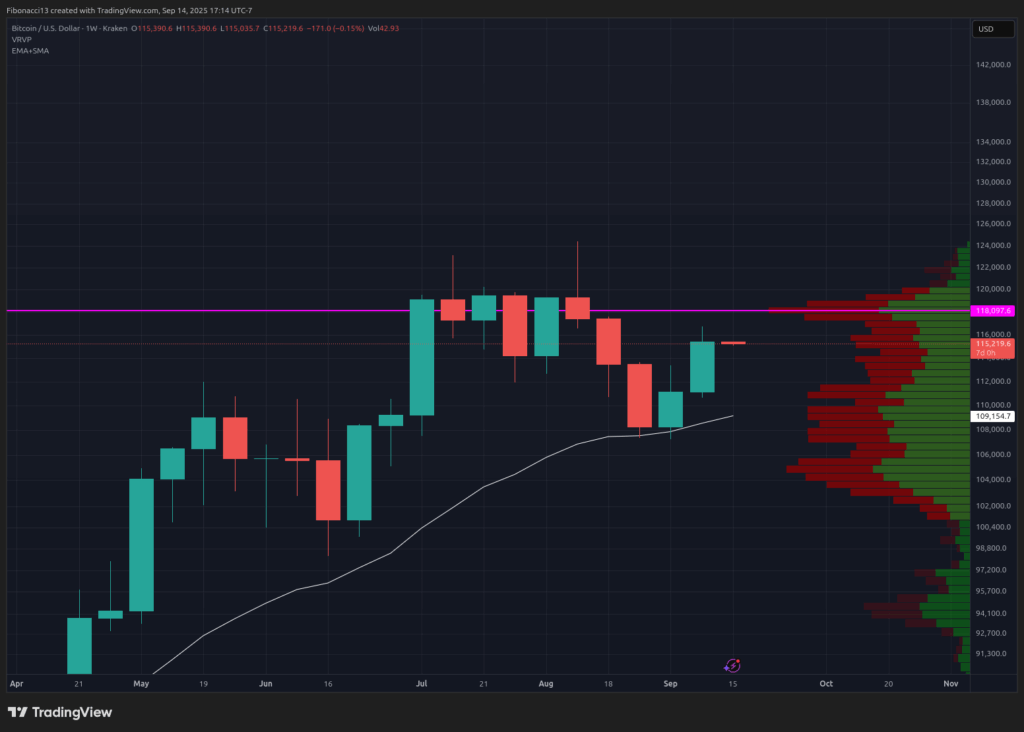
Entering this week, the $115,500 level is the next resistance level bitcoin will be looking to close above. $118,000 will be standing in the way above here, however. If bitcoin puts in another strong week, it is possible the price pushes above the $118,000 level intraweek only to close back below it on Sunday. We should expect sellers to step in strongly there and pressure bulls to give back some ground.
If bitcoin sees any weakness this week, or a rejection from the $118,000 level, we should look down to the $113,800 level for short-term support. Below there, we have weekly support sitting at $111,000. Closing below there would likely challenge the $107,000 low.
Outlook For This Week
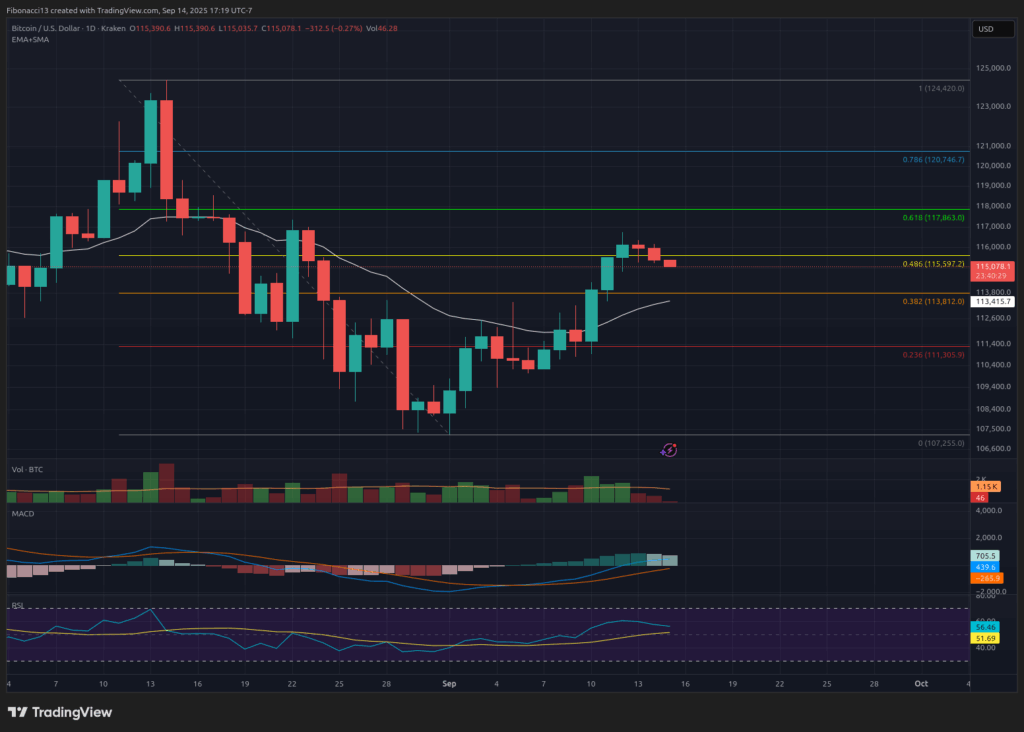
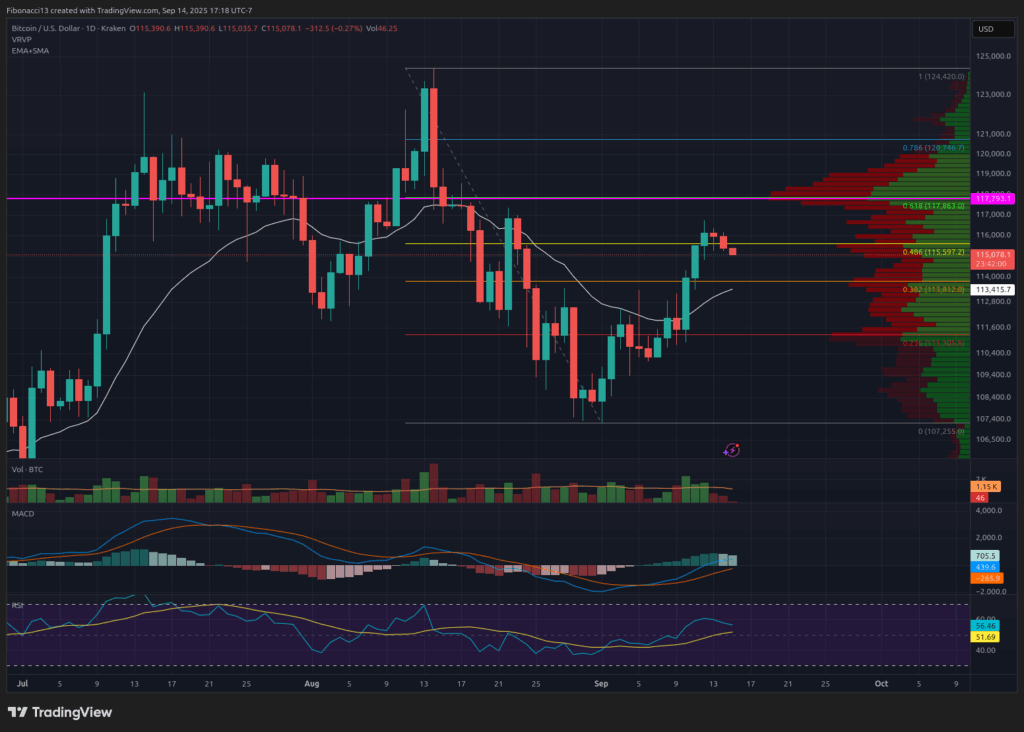
Zooming into the daily chart, bias is just slightly bearish as of Sunday’s close, after rejecting from $116,700 last Friday. This could quickly return to a bullish bias, though, if Monday’s US stock market price action resumes its bullish trend as well. The MACD is currently trying to hold above the zero line and re-establish it as support for bullish momentum to resume. Meanwhile, the RSI is dipping but remains in a bullish posture. It will look to the 13 SMA for support if selling intensifies into Tuesday.
All eyes will be on Chairman Powell and the Federal Reserve on Wednesday as he speaks at 2:30 PM Eastern. With anything other than a 0.25% rate cut announcement at 2:00 PM likely to cause significant market volatility that would surely spill over into bitcoin.
Market mood: Bullish, after two green weekly candles in a row — expecting the $118,000 level to be tested this week.
The next few weeks
Maintaining momentum above $118,000 will be key in the coming weeks if bitcoin can leap over this impending hurdle in the near future. I would expect bitcoin to continue into the $130,000s if it can establish $118,000 as support once again.
Assuming the Fed lowers rates this week, the market will then look forward to October for an additional interest rate cut. Therefore, supportive market data and continued cuts will be crucial to bitcoin’s price path going forward, fueling a bullish continuation to new highs.
On the flip side, any significant bearish events, or the Fed surprising everyone with a decision not to cut on Wednesday, will surely send the bitcoin price back down to test support levels.
Terminology Guide:
Bulls/Bullish: Buyers or investors expecting the price to go higher.
Bears/Bearish: Sellers or investors expecting the price to go lower.
Support or support level: A level at which the price should hold for the asset, at least initially. The more touches on support, the weaker it gets and the more likely it is to fail to hold the price.
Resistance or resistance level: Opposite of support. The level that is likely to reject the price, at least initially. The more touches at resistance, the weaker it gets and the more likely it is to fail to hold back the price.
SMA: Simple Moving Average. Average price based on closing prices over the specified period. In the case of RSI, it is the average strength index value over the specified period.
Oscillators: Technical indicators that vary over time, but typically remain within a band between set levels. Thus, they oscillate between a low level (typically representing oversold conditions) and a high level (typically representing overbought conditions). E.G., Relative Strength Index (RSI) and Moving Average Convergence-Divergence (MACD).
MACD Oscillator: Moving Average Convergence-Divergence is a momentum oscillator that subtracts the difference between 2 moving averages to indicate trend as well as momentum.
RSI Oscillator: The Relative Strength Index is a momentum oscillator that moves between 0 and 100. It measures the speed of the price and changes in the speed of the price movements. When RSI is over 70, it is considered to be overbought. When RSI is below 30, it is considered to be oversold.


