Are Nonbank Financial Institutions Systemic?


Recent events have heightened awareness of systemic risk stemming from nonbank financial sectors. For example, during the COVID-19 pandemic, liquidity demand from nonbank financial entities caused a “dash for cash” in financial markets that required government support. In this post, we provide a quantitative assessment of systemic risk in the nonbank sectors. Even though these sectors have heterogeneous business models, ranging from insurance to trading and asset management, we find that their systemic risk has common variation, and this commonality has increased over time. Moreover, nonbank sectors tend to become more systemic when banking sector systemic risk increases.
Measuring Nonbank Systemic Risk
We use the dollar SRISK measure of systemic risk for U.S. financial firms from the NYU-Stern V-Lab. This measure is defined as the expected capital shortfall of a firm in a crisis situation and indicates the firm’s contribution to undercapitalization of the financial system when in distress. Undercapitalization is of consequence since it may lead to credit retrenchment by financial firms. While the measure is available daily, we use monthly averages in order to smooth over day-to-day volatility.
Each firm is assigned to the banking sector (depository credit institutions) or one of five nonbank sectors (asset management, insurance, non-depository credit institutions, real estate, and trading) based on its North American Industrial Classification System (NAICS) code. Since NAICS codes classify firms by their primary activity, some bank holding companies (BHCs) with significant nonbank business lines are tagged as non-depository credit institutions. If, instead, we count all BHCs as banks, the results are similar. To get the sector SRISK, we sum SRISK across firms in each sector, assigning zero when the value is negative (which is tantamount to assuming that capital surplus firms cannot take over a capital deficit firm in a crisis). Since we compare across sectors with different firm sizes and, further, the number of firms in each sector changes over time, we divide the sector SRISK by the total book value of assets of firms in the sector. While doing so dilutes the effect of size on systemic risk, we find that larger firms have higher SRISK per dollar of assets in recessions.
Bank and nonbank systemic risk may move together because they have common exposure to the macroeconomy and to funding difficulties (because, for example, banks often fund nonbanks). The chart below plots the SRISK asset shares of banks and the aggregate of all nonbank sectors, along with the NBER recession indicator. Bank and nonbank systemic risk co-move, rising during the past two recessions (the Great Financial Crisis (GFC) and the COVID-19 pandemic), as well as around June 2011 at the start of the European debt crisis. As further evidence of co-movement, we estimate using principal components analysis (PCA) that a single factor explains 88 percent of the common variation in bank and nonbank systemic risk and this factor is correlated with macroeconomic outcomes such as the NBER recession indicator and changes in the tightness of financial conditions broadly.
Bank and Aggregate Nonbank Systemic Risk Co-Move

Notes: The chart plots the asset shares of SRISK for banks and nonbanks, along with the NBER recession indicator. The sample is 2001 to 2023.
Systemic Risk of Nonbank Sectors
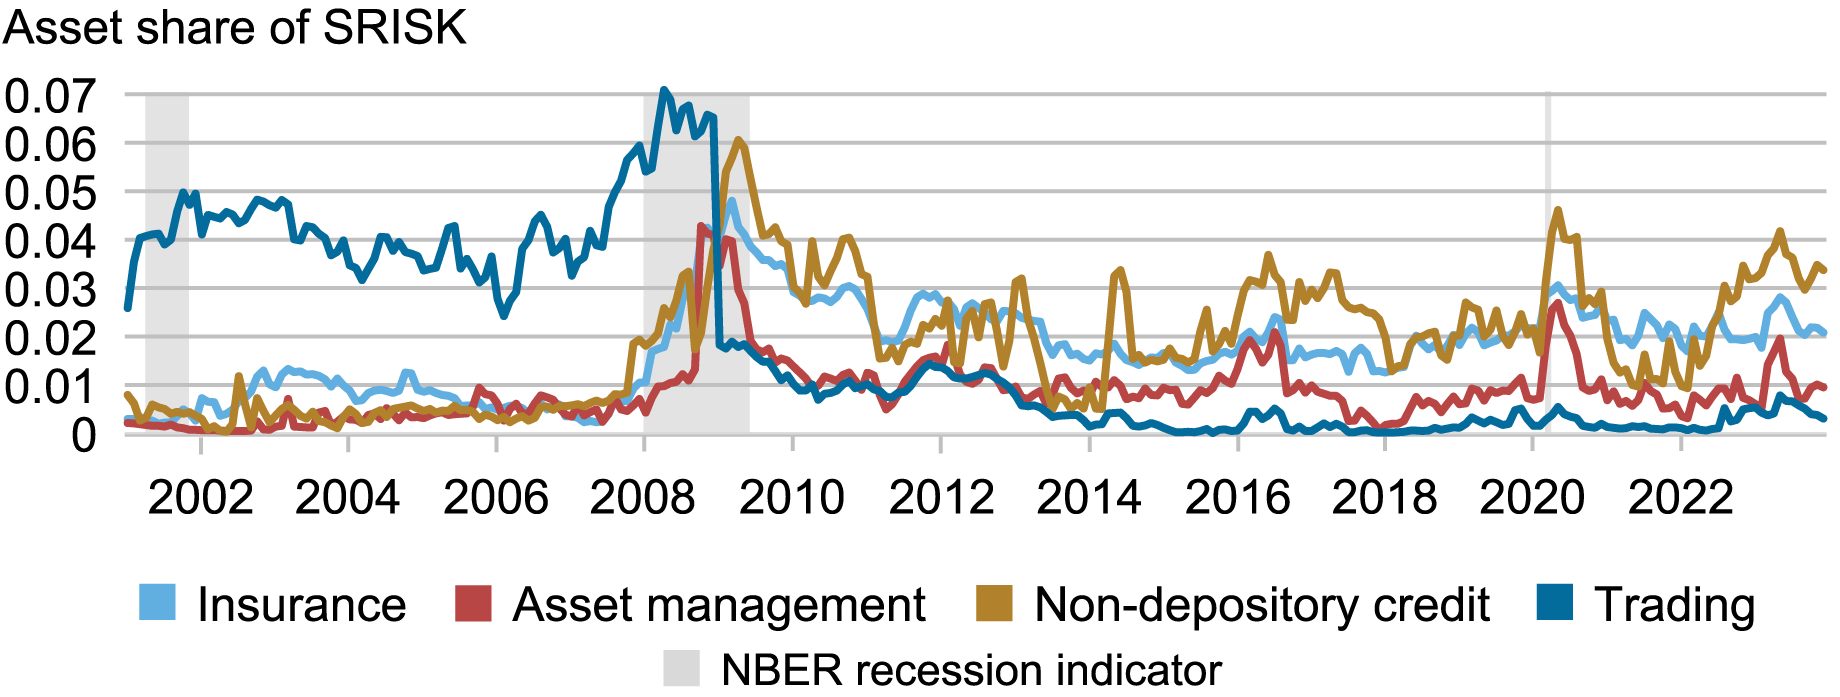
The chart below shows the SRISK shares of four nonbank sectors; from this point, we omit the real estate sector as it has too few firms for reliable inference. The trading sector was initially the most systemic but becomes the least systemic after 2008. This happened because Merrill Lynch, a trading firm, had a dominant share of the sector’s systemic risk but was acquired by Bank of America in September 2008. Hence, its systemic risk migrated to the banking sector by virtue of this acquisition. This event highlights how bank holding companies may incorporate the systemic risk of nonbanks, as recent research has highlighted (see here, here, and here). Since September 2008, the SRISK shares of the non-depository credit sector and the insurance sector have generally been the highest of all nonbank sectors. Moreover, since the Federal Reserve started to hike interest rates in the first quarter of 2022, the SRISK share of the non-depository credit sector has spiked, mainly due to firms engaged in loan servicing. Interestingly, while there has been much interest in the systemic risk of the asset management sector, its SRISK share is relatively low.
The Systemic Importance of Nonbank Sectors Changes over Time

Notes: The chart plots the asset shares of SRISK for these nonbank sectors: asset management, insurance, non-depository credit, and trading, along with the NBER recession indicator. The sample is 2001 to 2023.
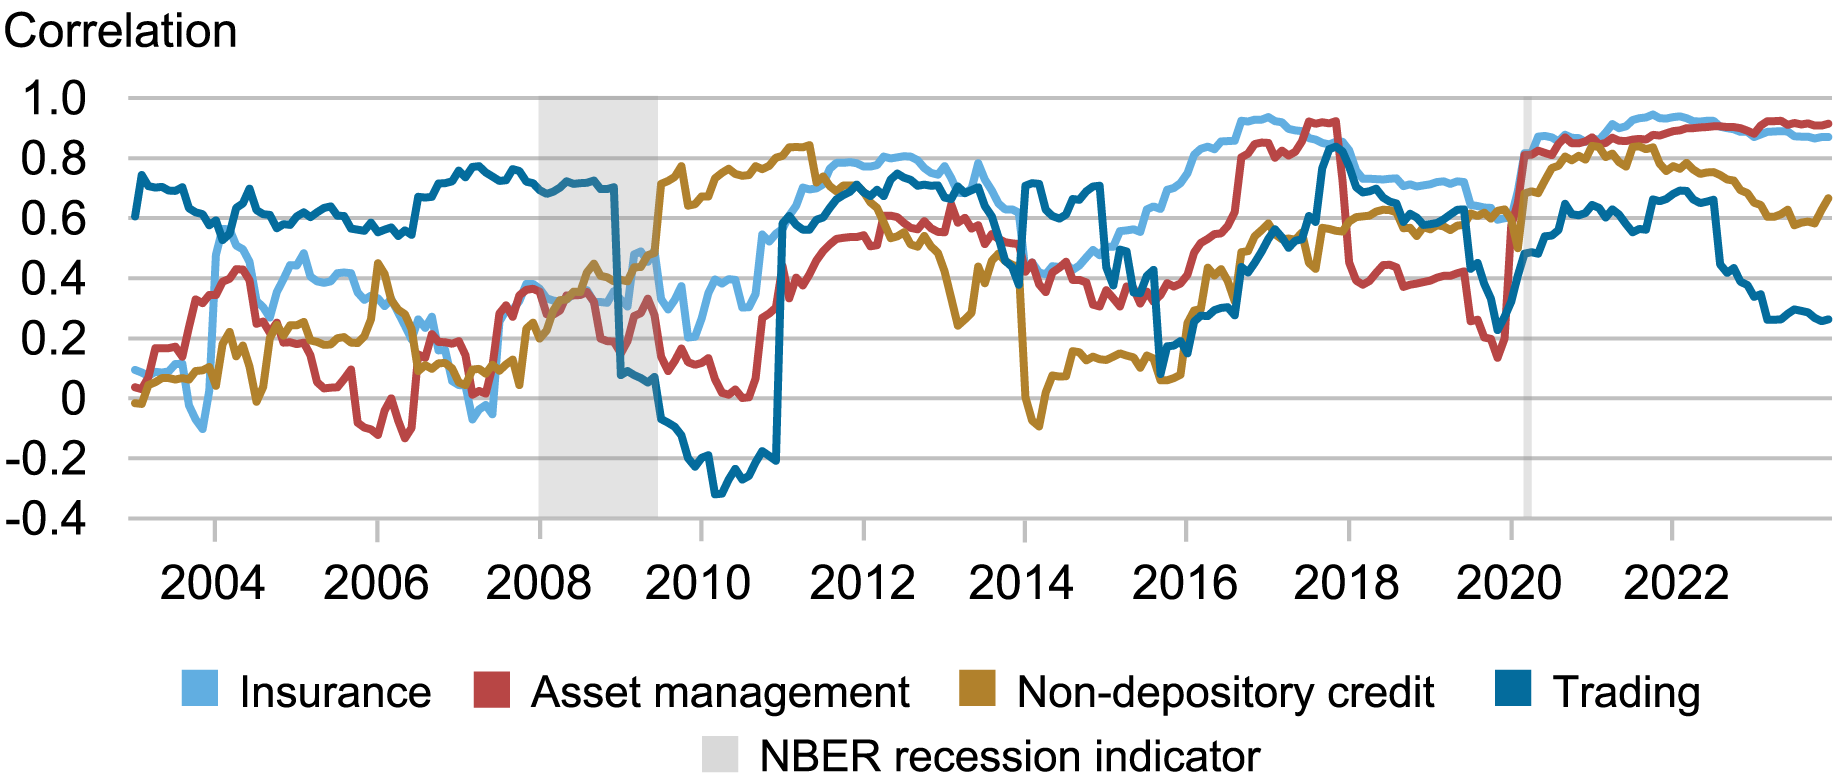
The next chart suggests that the systemic risk of nonbank sectors may be more aligned during NBER recessions, as compared to normal times. We show in the chart below twenty-four-month rolling correlations of the log change in SRISK shares of each nonbank sector with the log change in the banking sector SRISK share. The correlation spikes during recessions (except for the trading sector during the GFC, a mechanical effect due to the Merrill Lynch acquisition discussed above). More generally, however, each nonbank sector has become increasingly correlated with the banking sector. The two most systemic nonbank sectors (non-depository credit and insurance) also have high correlations with the banking sector systemic risk. Notably, while the asset management sector has relatively low SRISK share, it is generally the most correlated with banks since the COVID-19 pandemic. This result reinforces the observation (see here, for example) that, to assess the systemic risk of a nonbank sector, it is insufficient to only consider its own systemic footprint; rather it is also important to consider its interconnections with the banking sector.
Nonbank Sectors Co-Move More with Banks During Crises

Notes: The chart plots the twenty-four-month moving correlation of the log change in asset shares of SRISK for each of four nonbank sectors (asset management, insurance, non-depository credit, and trading) with the log change in SRISK share of the banking sector, along with the NBER recession indicator. The sample is 2001 to 2023. The horizontal axis indicates the end-month of the window over which the correlation is calculated.
Heterogeneity of Nonbank Sector Systemic Risk
So far, we have emphasized the commonalities in systemic risk within nonbank sectors and between these sectors and banking, especially during recessions. Nonbank sectors, however, have quite distinct business models (for example, insurance versus asset management). To examine this heterogeneity, we conduct PCA of the log change in the SRISK shares of the nonbank sectors.
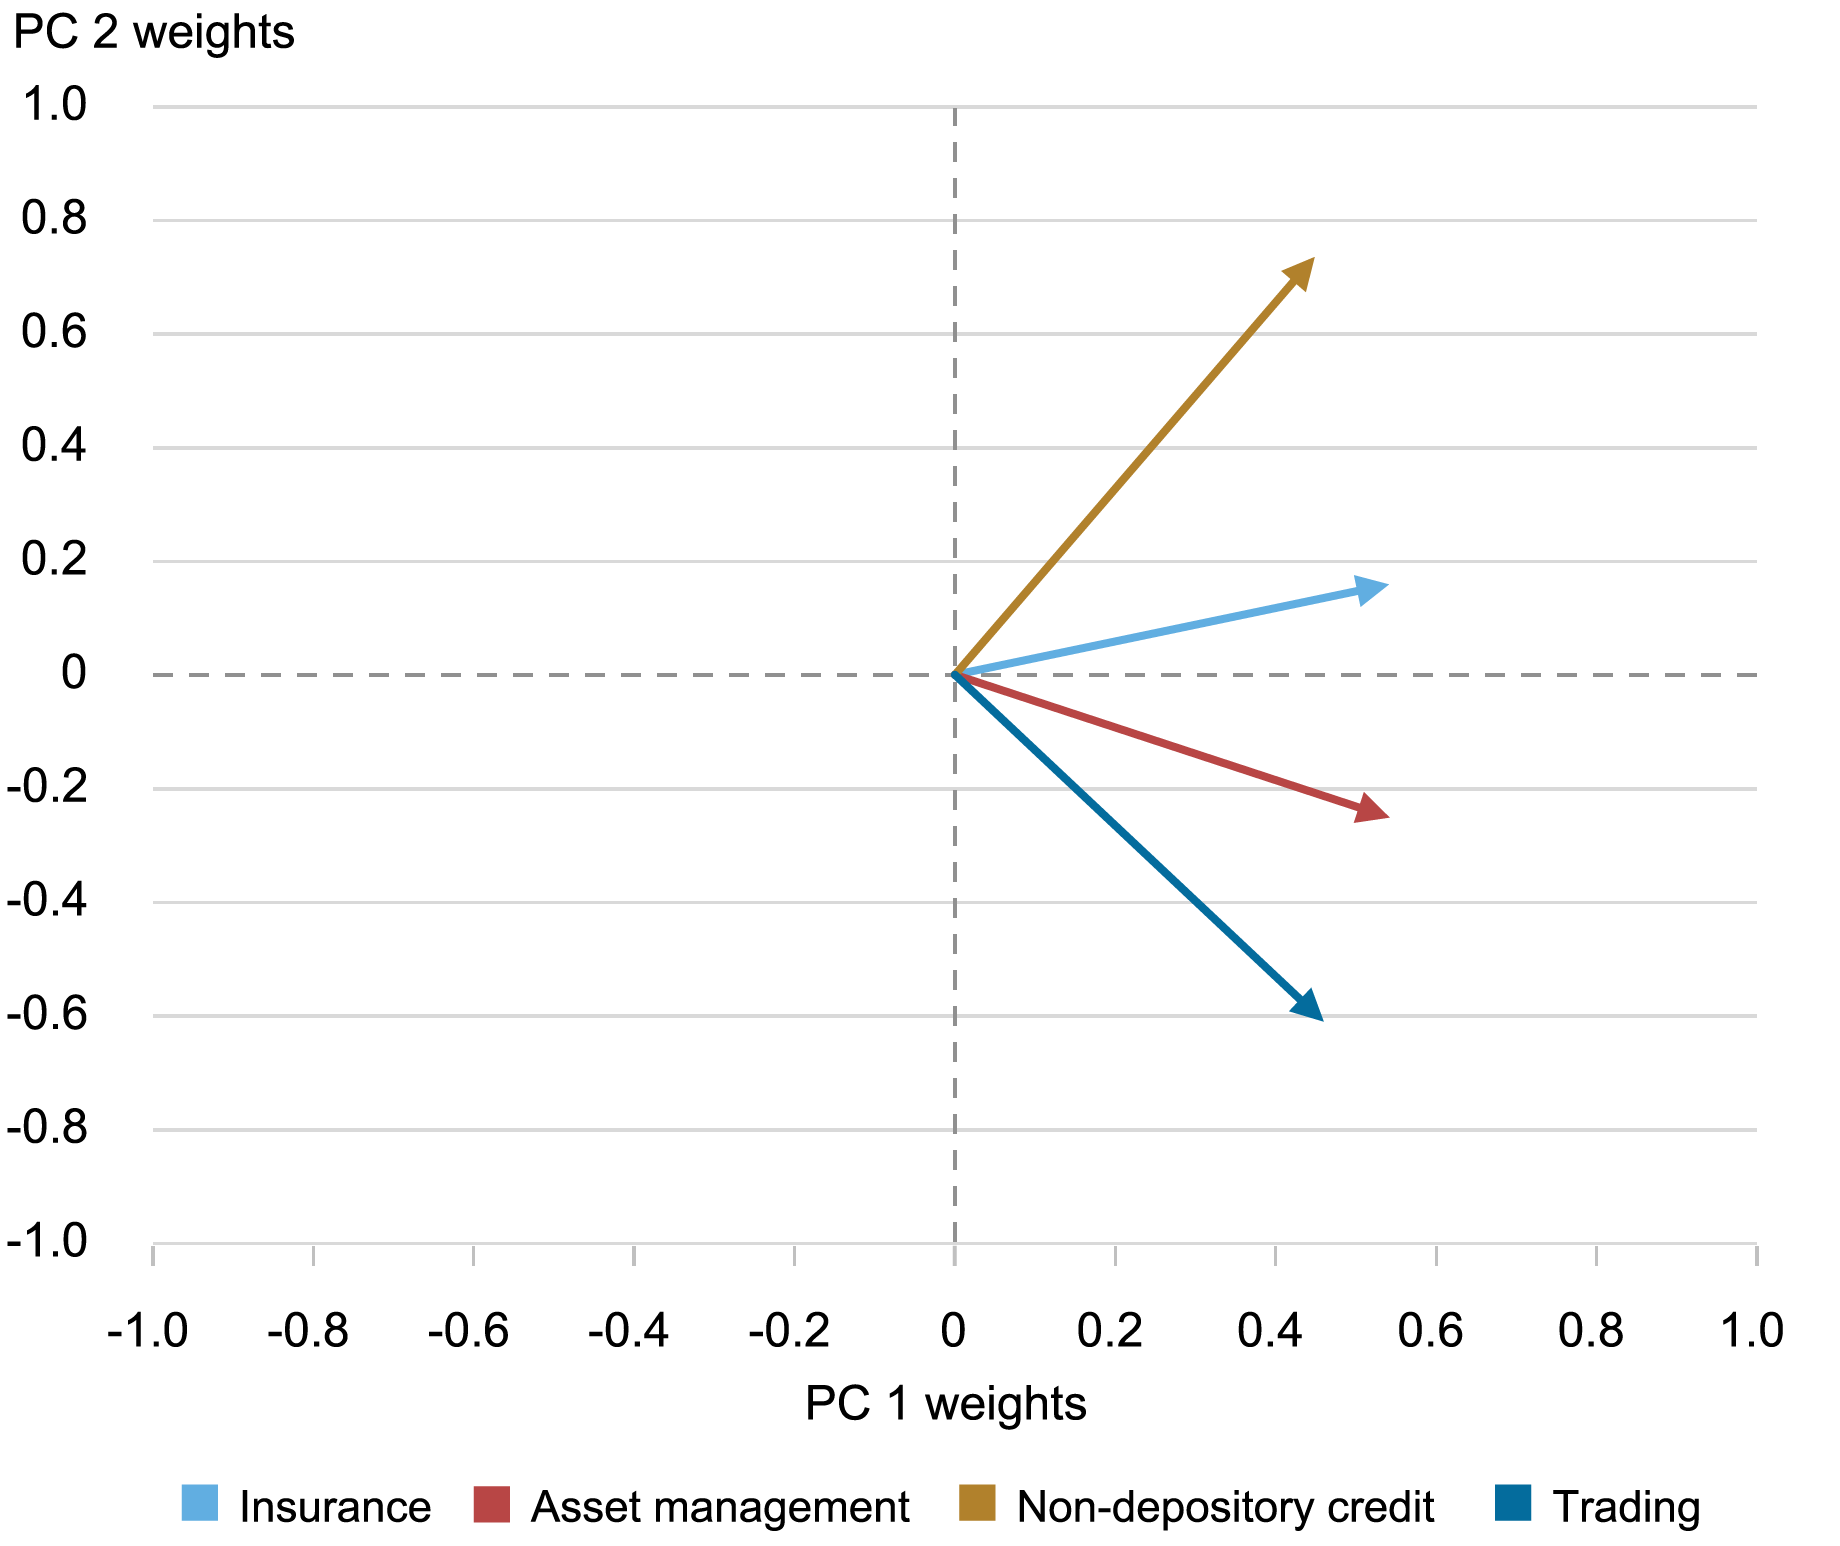
We focus on the first two principal components, which together explain more than 66 percent of the total variation of the four nonbank sectors, suggesting strong commonality between the nonbank sectors on average. The chart below shows how the two principal components load on the four nonbank sectors, as indicated by the four vectors. The first principal component (PC1), which explains more than 46 percent of the total variation of all sectors, loads similarly on each sector, as shown by the x-axis values. Thus, this component is close to an equal-weighted index and highlights similarities in the systemic risk of different nonbank sectors. By contrast, the second principal component (PC2) has a more than 73 percent weight on the non-depository credit sector (as shown by the y-axis value), along with short (or negative) positions on the trading and asset management sectors. In other words, this component highlights divergences in the evolution of systemic risk of different types of nonbank intermediation services.
Commonalities and Divergences in Nonbank Sector Systemic Risk

Notes: The spider chart plots the sector loadings of the first two principal components of the log change in asset shares of SRISK of four nonbank sectors (asset management, insurance, non-depository credit, and trading). The horizontal axis plots the loadings from the first principal component (PC1) while the vertical axis plots loadings from the second principal component (PC2). The sample is 2001 to 2023.
How has nonbank sector heterogeneity evolved over the past twenty years? We repeat the PCA analysis separately for nine periods corresponding to major events such as the GFC and the COVID-19 pandemic. The chart below shows the total variation in the systemic risk of the four nonbank sectors captured by the first two principal components in each of these nine periods. In combination, the two principal components explain an increasing proportion of the total variation in SRISK shares of the nonbank sectors, from about 60 percent initially to 90 percent since the COVID-19 pandemic. Thus, the systemic risk of different nonbank sectors increasingly evolves in a common way. While the commonality is high in crises, as may be expected, it has not decreased substantially in normal times, especially recently.
Nonbank Sector Systemic Risk Increasingly Moves Together
Notes: The chart plots the proportion of total variance of the log change in asset shares of SRISK of four nonbank sectors (asset management, insurance, non-depository credit and trading) explained by the first two principal components (PC1 and PC2) for nine periods separately. The periods are: Pre-GFC (January 2001-July 2007; GFC (August 2007-October 2009); Post-GFC (November 2009-November 2014); Oil (December 2014-June 2016); Rate hike (July 2016-February 2020); COVID-19 (March 2020 to October 2021); Post-COVID (November 2021 to December 2022); Silicon Valley Bank [SVB] (January 2023 to May 2023); Post-SVB (June 2023-December 2023). The blue color signifies the percentage of total variation explained by PC1 and the orange the percentage of variation explained by PC2. The sample is 2001 to 2023.
Final Words
The systemic risk of diverse nonbank sectors has common variation that increases when banking sector systemic risk increases, consistent with recent crisis episodes where both bank and nonbank sectors have become stressed. In future work, we plan to explore the robustness of these findings to other measures of systemic risk.
Andres Aradillas Fernandez was an undergraduate research intern in the Federal Reserve Bank of New York’s Research and Statistics Group at the time this post was written.

Martin Hiti is a research analyst in the Federal Reserve Bank of New York’s Research and Statistics Group.

Asani Sarkar is a financial research advisor in Non-Bank Financial Institution Studies in the Federal Reserve Bank of New York’s Research and Statistics Group.
How to cite this post:
Andres Aradillas Fernandez, Martin Hiti, and Asani Sarkar, “Are Nonbank Financial Institutions Systemic?,” Federal Reserve Bank of New York Liberty Street Economics, October 1, 2024, https://libertystreeteconomics.newyorkfed.org/2024/10/are-nonbank-financial-institutions-systemic/.
Disclaimer
The views expressed in this post are those of the author(s) and do not necessarily reflect the position of the Federal Reserve Bank of New York or the Federal Reserve System. Any errors or omissions are the responsibility of the author(s).


